boring tax stuff
30 Aug 2004Rich on the CBO tax report:
Everybody is paying less in taxes under the new tax laws. But the high income tax payers are accounting for a higher portion of total income tax receipts. It has to be one of two things. Either there are more people in the top 20%, or the top 20% is recording more income. In other words, we’re creating wealth.
That conclusion doesn’t logically follow, and I’m going to use this as an excuse to try to give an explanation for the ramifications of the Bush tax cuts and the CBO report on their effects.
Rich seems to overlook that we have a tax structure in brackets – taxes for everyone can decrease across the board while the “share” still increases and decreases for different brackets. Which is precisely what happened, as we see in the breakdown by quintile:
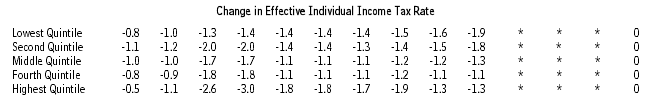
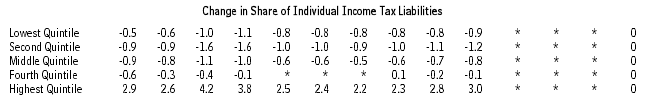
You can clearly see that everyone’s income tax rate went down, but the share for the highest quintile goes up consistently. This doesn’t mean we’re “creating wealth”. This CBO report focuses on the effect of the change in tax policy, not tax revenue intake. It just means we’ve shuffled things around a bit so everyone pays less on the aggregate, but the highest quintile pays more as a share of income tax than they did previously. Whether or not this tax policy is creating any wealth or not would require an entirely different (and much more difficult) analysis.
That the highest quintile is actually paying more income tax is what a lot of conservatives are harping on when they accuse the SCLM of presenting an incomplete picture of the CBO report. But, the truth is that the CBO report includes the complete picture, and they want us to ignore it. How is it that the tax burden was shifted to the middle class if the rich are actually paying more income tax? Easy: payroll taxes. This is best illustrated by a very crude, simplified example:
|
Income ($/yr) |
Payroll Taxes Owed ($) |
Income Tax Rate (%) |
Income Taxes Owed ($) |
Total Taxes Owed ($) |
Tax Burden (% of income) |
Tax Share (% of tax revenue) |
|
|---|---|---|---|---|---|---|---|
| Imaginary Rich Guy | 200000 | 20000 | 60 | 120000 | 140000 | 70 | 82.35294118 |
| Imaginary Middle-Class Guy | 50000 | 20000 | 20 | 10000 | 30000 | 60 | 17.64705882 |
|
Income ($/yr) |
Payroll Taxes Owed ($) |
Income Tax Rate (%) |
Income Taxes Owed ($) |
Total Taxes Owed ($) |
Tax Burden (% of income) |
Tax Share (% of tax revenue) |
|
|---|---|---|---|---|---|---|---|
| Imaginary Rich Guy | 200000 | 20000 | 40 | 80000 | 100000 | 50 | 80 |
| Imaginary Middle-Class Guy | 50000 | 20000 | 10 | 5000 | 25000 | 50 | 20 |
|
Change in Tax Burden (% of income) |
Change in Tax Share (% of tax revenue) |
|
|---|---|---|
| Imaginary Rich Guy | -20 | -2.352941176 |
| Imaginary Middle-Class Guy | -10 | 2.352941176 |
Here we see two hypothetical people, one rich, one not, to which there are applied two different income-tax rates and one fixed sum of payroll taxes. Naturally payroll taxes are not actually fixed, but they are a flate rate (15% or so) levied up to a certain amount of your income ($70k or so). Since it only applies to a certain fixed portion of income, as it pertains to high-income households, it’s basically a fixed tax of a small amount that pales in comparison to their income tax.
As you can see, a hypothetical income tax cut is enacted in the “after” chart, from 60 to 40% for the rich guy, and 20 to 10% for the middle-class guy. Note that as a result:
- Income tax rates went down for both individuals
- Tax burden went down for both individuals
- The rich guy now pays a larger income tax rate than the middle-class (4x the rate, as opposed to 3x the rate)
And yet, we see that because of the fixed presence of the payroll tax, this actually results in the middle-class guy paying a larger percentage of our hypothetical 2-person’s tax base. This is because income taxes are not the whole story, and payroll taxes are the biggest tax burden facing low and middle class taxpayers. Thus, an income tax cut, even across the board, benefits the wealthy, because it affects them far greater, and shifts the tax shouldered from the backs of the wealthy to the middle-class.
Chris, don’t juggle numbers unless you’re wearing Kevlar gloves; you’ll lose fingers. It’s not that difficult to analyze. If your effective rate for the quintile goes down, as it did, but your share of the total taxes went up, there’s only a couple of possible explanations. If total receipts went down, then other quintiles’ effective rates must have declined more than yours (ie, they got a bigger cut).Since liberals have been endlessly pointing out that the wealthiest quintile got the biggest cut, we know that isn’t the case. The other option is that receipts either remained the same or increased. In either case, for the effective rate to decrease, and for share to increase, there are only two possibilities. Either the other quintiles got a bigger cut (already disproved) or the upper quintile reported more income. (ie created wealth)
If you can find another possibility, by all means, share it with the rest of us.