The Impact of Socioeconomic Status on Consumption of Carbohydrates
07 May 2004by Amanda Harasty
For the past fifty years nutritionists have encouraged Americans to eat a diet low in fat and high in carbohydrates as a way to maintain a health lifestyle and body weight. Recently, this nutritional paradigm has come under attack by a group of scientists who argue that the reverse is true: a diet that is low in carbohydrates is the best way to maintain a healthy lifestyle and body weight.
The purpose of this study is to explore the role that socioeconomic status plays on an individual’s access to low carbohydrate foods. In short, this study attempts to explore whether or not people of lower socioeconomic statuses will find economic or other barriers to eating healthily under a nutritional paradigm that values lowering carbohydrate consumption.
A review of the literature will help provide justification of this question by showing the disadvantages faced by people of lower socioeconomic statuses in their attempt to eat “healthily” under the low-fat nutritional paradigm.
Low-income, obesity, and fat: a review
Much of the nutrition literature reinforces the low fat paradigm. It reinforces the idea that the consumption of fat is a direct cause of obesity and health problems related to obesity.
Kubick, et al argue that food available to children in school through vending machines and al la cart programs are high in fat and therefore unhealthy.1 The authors suggest that children should lower their intake of snacks containing 5 or more grams of fat and increase their intake of fruit juice and milk.
Patterson et al argue that the availability of high fat foods leads to a greater consumption of high fat foods. The consumption of high fat foods in turn leads to an unhealthy diet.2 An obvious critique of this argument (from the perspective of a low carbohydrate diet/framework) is that this logic applies to any food available. In other words, if the availability of high carbohydrate food increases, it would follow that the consumption of high carbohydrate food increases.
Retzlaff et al suggest that diets high in fat lead to high cholesterol3, while Champagne et al state that unhealthy diets are those with poor adherence to the Food and Drug Administration’s food pyramid.4 The food pyramid recommends six to twelve servings of grain, which by definition contain carbohydrates, three to five servings of vegetables, two to four servings of vegetables, and two to three servings of dairy, all of which may contain carbohydrates. It also recommends the use of fats “sparingly”. These article all commit a logical fallacy of post hoc ergo propter hoc, or “after this therefore because of this”. None of them examine the effects of carbohydrate intake on what they define as an unhealthy person. These studies focus on fat intake without controlling for other factors, including carbohydrate intake. Since they are only looking at the fat variable for having an adverse effect on health, they are missing other possible explanations.
Only one study in the literature reviewed here mentions the effects of poor fiber intake. Kayrooz et al explain how a diet both high in fat and low in fiber contributes to unhealthy diets among urban African American women.5 The authors make another point with more immediate relation to this study. The article states that there is a possible causal link between dietary fat intake and cardiovascular disease. There is no direct evidence to this link. This leaves room for the possibility of other partial or whole causes.
The literature provides additional, more mainstream criticisms of the food pyramid. The pyramid does not draw a distinction between complex and simple carbohydrates. Complex carbohydrates include foods high in fiber and whole grains. These carbohydrates are broken down more slowly and help maintain a consistent level of blood sugar and insulin production. There is also evidence that consumption of complex carbohydrates can help lower the risk of type II diabetes, a disease often associated with an unhealthy diet.6 This is additionally supported in Robbins’ et al study that showed a positive correlation between occurrence of type two diabetes in African American and Hispanic males and socioeconomic status.7
Little et al provides a more general criticism of nutritional studies. Their research says that up to 40 percent under-report energy intake in nutritional studies.8 This places an element of doubt on all nutritional research involving experiments tracking individual eating patterns or choices.
The literature also makes a strong argument that those of lower socioeconomic statuses are likely to have an unhealthy diet as defined by high fat consumption. Rankin et al analyzed supermarket receipts and found that families who were most likely to make poor food choices (as defined as more than 30% of calories from fat and less than 25 grams of fiber) were people from the lower and lower middle quartile socioeconomic status (approximately $10,000-$30,00 per year).9 They also state the National Cancer Institute’s recommendation that Americans reduce total dietary fat below 30% of energy, increase dietary fiber to 25 to 30 grams/day, and increase fruits and vegetable consumption to at least five servings per day.
Haas et al linked lack of health insurance to obesity in children. 10 While there was no discussion of causes of obesity, the authors come to the conclusion that children from low socioeconomic statuses are most likely to be obese. The article also links childhood obesity to such health complications as diabetes. The article also points out the difficulty in adults of maintaining consistent and sustained weight loss. This suggests that it is important to develop an eating strategy to keep children at healthy weight. Given that rates of child obesity are at records numbers11, this article helps present a case for rethinking our fundamental assumptions about food and nutrition and re-tailor them in a way that helps combat rates of childhood obesity.
Goodman et al provide similar findings. While there is no reason given for higher rates of obesity in children of lower socioeconomic status within their study, it does confirm that there is a positive correlation.12 The article looks specifically at educational level of children’s parents and parents’ income. The article finds that as both education and income decrease in parents, that obesity increases in children.
Wang looked at obesity cross-nationally and found that while American adults and children were both more likely to be obese if they are from a lower socioeconomic status, the reverse is true in China, which suggests other factors are involved in obesity other than concentration of fat in diet.13 While the implication is that some of these causes may be social, there is also the possibility that causes are related to issues of food distribution and structure. For example, some of these differences might be explained in terms of people of lower socioeconomic statuses’ access to sugar and refined grains (especially wheat and corn).
Kim et al find similar results in comparing nutrition and income in both China and the United States.14 Again, this implies that access to different foods due to technological advancements and relatively unencumbered distribution in the United States has an effect our rates of obesity as well as additional social causes.
Jeffery et al looked at weight control practices among women of different socioeconomic status and found that while all groups of women have difficulty losing weight, women of higher socioeconomic status have an easier time maintaining a particular weight.15 The study shows that women of lower socioeconomic status receive more exercise, they consume more fat (37% for lowest category and 33% for the highest). Yet, at the same time, the authors note that the differences between rates of exercise among women of different socioeconomic statues are not significant. This reinforces the position of diet as the main factor in the difference between the rates of obesity in woman across socioeconomic status. Again, the study neglects testing for or controlling for carbohydrate intake.
The literature states that people of lower socioeconomic statuses are not only more likely to develop obesity, but they are also more likely to have sub-optimal nutritional intake, or in other words, poor nutrition.16 Mazur et al make similar conclusions when examining the Mexican American population specifically.17
The concept of increased obesity and decreased nutrition are consistent with Engel’s Law, which states that as income increases, expenditure for food and sundries decreases, for both the individual and the aggregate. Or in the words of Drewnowski: “Consistent with Engel’s law, poor U.S. households devoted a far greater share of their disposable income to food compared with rich households. Households in the top quintile by income (mean income, $77,311) spent $1,997 per person for food in 1992 compared with $1,249 spent by those in the bottom quintile (mean income, $6,669). USDA studies showed that low income families purchased lower cost items and spent their limited resources on fats, sweets and alcohol.”18 Drewnowski also states that “Recent studies based on a linear programming model suggest that imposing a constraint on diet costs forces dietary choices in the direction of more cereals, sugars and fat.”
Norris et al discusses the changes and trends in American food consumption since 1977. The study indicates that between 1987 and 1992 total energy from fat dropped by 2.3%.19 Yet, according to the Center for Disease Control, the rate of obesity has continued to rise throughout the United States, suggesting that mainstream nutritionist has over-stated the influence of fat on weight gain. The authors also state a noticed decrease in the total consumption of energy, implying that simply reducing intake of energy/food is not an effective means of weight control.
The Low-carbohydrate Paradigm
Recently, an alternative nutritional paradigm has garnered attention of the mainstream media and the scientific community. The most well known proponents of this diet are the late Dr. Atkins of the popular Atkins’ diet and Dr Arthur Agatston, author of the best selling “South Beach Diet”. Both physicians advocate a diet low in carbohydrates, especially refined carbohydrates. While the low carbohydrate diets have received much criticism and resistance, the diet was until recently ignored in the medical community.
Furthermore, recent studies have shown that low carbohydrate diets help dieters shed pounds and reduce cholesterol levels (Green et al20, Landers21). Yet, foods low in carbohydrates might be much less available to people of low socioeconomic statuses given that food such as meat and whole grains tend to be more expensive. This paper intends to establish that regardless of nutritional paradigm, low fat or low carbohydrate, people of lower socioeconomic statuses are less likely to consume a “healthy” diet.
Data and Methods
For the content analysis, thirty-six different food groups were chosen to be examined for several different variables. This list of foods is based on the individual food categories used in the NHANES data. The point of using the list from the NHANES was to choose common foods available throughout every region of the United States. Since the NHANES is a national survey, it asked about readily available and recognizable foods.
Out of sixty individual foods, seventeen foods were chosen. The selection was based on whether or not there existed a lower carbohydrate version of this food. Two versions of each food were compared: a regular and lower carbohydrate version.
When possible, the brand of the store (e.g. Kroger brand) were compared. If store brands were unavailable, two versions of the same brand were compared. If this option was unavailable, two nationally recognized brands were chosen for comparison.
Data was collected at three different Nashville-area grocery stores. Store 1 (Harris-Teeter) was built recently and located in an affluent part of town. There are only a few of these stores in Nashville. Store 2 (Kroger) is much more ubiquitous in the Nashville area. Store 1 and Store 2 were located 3.91 miles apart.
Store 3 (Save-a-Lot) was located in an area with a lower socioeconomic status. This store advertising itself as a discount or bargain grocery store. Store 1 and Store 3 were 2.48 miles apart. Store 2 and Store 3 were 5.65 miles apart. None of the stores were franchises of the same store (for example, there were not two or more Kroger’s grocery stores, etc). All three were at least regionally franchised grocery stores as opposed to locally and independently owned stores. All data was collected on the same day. No re-stocking was observed during data collection. Therefore, no new products recently stocked were missed in the analysis.
These stores were chosen in an attempt to get a sample of prices and selection in a variety of environments. While two stores were both located in more affluent areas, one was newer and attracted a more affluent clientele.
All three stores were in primarily commercial areas. No homes were in view from the parking lots of any of the stores.
Information was collected based on six different variables. These variables were: fat content, carbohydrate content, fiber content, price, serving size and calories.
In an attempt to contrast the regular and lower carbohydrate versions of each food, the percent change in total carbohydrates and the percent change in price were calculated. This allows the data to be presented in terms of change, not in terms of numbers. Because of this method, the only variables necessary were carbohydrates, fiber and cost. The amount of fiber was subtracted from the total amount of carbohydrates, because in most lower carbohydrate diets, fiber is considered a “no impact” carbohydrate and is not counted by dieters trying to stay within a daily allotment of carbohydrates.
Numbers for each food pair were corrected for differences in serving size or differences in product size. Thus all comparisons are based on the same portion size for the total number of carbohydrates and the same product size for total price.
A flaw in comparing percentages is that foods with small carbohydrate content tend to show large percentage decreases (e.g. 3g to 2g, a 30% decrease), even though this change is not particularly important for a health benefit. These examples will be noted when relevant.
A second content analysis was done on ground beef, chicken breast, chicken thighs, and chuck steak. The price per serving, serving size and calories were recorded and then the price per calorie extrapolated. These numbers were then compared to the price per calorie of regular pasta. This method attempts to show the difference in cost between eating meat, which contains no carbohydrates, to pasta, a common food high in carbohydrates. Pasta was used as a basis of comparison rather than rice, bread or potatoes because people often make an entire meal out of pasta, but not these other high-carbohydrate options. Pasta was compared to a variety of meats, including chicken breast, chicken thighs, ground beef, and flank steak. The varieties of meat were chosen on the basis of providing a range of prices. Chicken breast is considerably more expensive than chicken thighs. Ground beef is generally the least expensive form of beef.
Results
Grocery Store 1 (Harris Teeter)
| Food | Carbs | Price | % Change in Carbs | % Change in Price |
| chocolate milk | 32 | 2.59 | ||
| low carb choc. Milk | 2 | 3.29 | -93.75 | 27.02702703 |
| ice cream | 15 | 4.99 | ||
| low carb ice cream | 7 | 4.99 | -53.33333333 | |
| pizza | n/a | n/a | n/a | n/a |
| low carb pizza | n/a | n/a | n/a | n/a |
| white pasta | 19.5 | 0.995 | ||
| whole wheat pasta | 34 | 2.39 | 74.35897436 | 140.201005 |
| fruit juice | 33 | 3.49 | ||
| low/no sugar juice | 10 | 3.49 | -69.6969697 | |
| peanut butter | n/a | n/a | n/a | n/a |
| low carb peanut butter | n/a | n/a | n/a | n/a |
| cereal | n/a | n/a | n/a | n/a |
| low carb cereal | n/a | n/a | n/a | n/a |
| white bread | 9.5 | 0.99 | ||
| low carb bread | 6 | 2.49 | -36.84210526 | 151.5151515 |
| flour tortillas | 23 | 0.215 | ||
| low carb tortillas | 5 | 0.275 | -78.26086957 | 27.90697674 |
| white rice | 35 | 5.6 | ||
| brown rice | 32 | 5.7 | -8.571428571 | 1.785714286 |
| cookies/cakes | n/a | n/a | n/a | n/a |
| low carb cookies/cakes | n/a | n/a | n/a | n/a |
| soda | 39 | 3.5 | ||
| diet soda | 3.5 | -100 | ||
| chocolate candy | n/a | n/a | n/a | n/a |
| low carb choc. candy | n/a | n/a | n/a | n/a |
| candy misc | n/a | n/a | n/a | n/a |
| low carb candy misc | n/a | n/a | n/a | n/a |
| light beer | 11.79 | 7.9 | ||
| low carb beer | 2.6 | 7.9 | -77.94741306 |
Of 15 pairs of food examined, only 10 were found to have low carbohydrate options available in the store. These items were chocolate milk, ice cream, pasta, fruit juice, cereal, bread, tortillas, rice, soda and beer.
Of these 11 items, 5 of the low carbohydrate items were more expensive than the regular carbohydrate items. These items were chocolate milk, pasta, cereal, bread, tortillas and rice.
Of the 4 items not more expensive than low carbohydrate items, all 4 were the same price. These items were ice cream, fruit juice, soda and beer.
The average percent change in price between regular carbohydrate and low carbohydrates items was 43.56%. In other words, on average, low carbohydrate items were 43.56% more expensive then regular carbohydrate items in Grocery Store 1.
In 10 out of the 11 foods defined as low carbohydrate, there was a drop in the amount of carbohydrates corrected for fiber content. Whole-wheat pasta contained 74.36% more carbohydrates than regular white pasta.
The average change in carbohydrates between low carbohydrate and regular carbohydrate items was -49.33%. In other words, the low carbohydrate foods contained -49.33% less carbohydrates than the regular carbohydrate foods. If this number is computed without whole-wheat pasta that I mistakenly expected to be lower in carbohydrates than white pasta, the average change in carbohydrates is -64.80.
Grocery Store 2 (Kroger)
| Food | Carbs | Price | % Change in Carbs | % Change in Price |
| chocolate milk | 35 | 1.89 | ||
| low carb choc. Milk | 2 | 3.29 | -94.28571429 | 74.07407407 |
| ice cream | 17 | 1.095 | ||
| low carb ice cream | 10 | 3.99 | -41.17647059 | 264.3835616 |
| pizza | 41 | 4.79 | ||
| low carb pizza | 17 | 11.94 | -58.53658537 | 149.2693111 |
| white pasta | 40 | 1.07 | ||
| whole wheat pasta | 40 | 1.79 | 67.28971963 | |
| fruit juice | 35 | 3.15 | ||
| low/no sugar juice | 10 | 3.15 | -71.42857143 | |
| peanut butter | 5 | 3.15 | ||
| low carb peanut butter | 3 | 5.72 | -40 | 81.58730159 |
| cereal | 23 | 0.126 | ||
| low carb cereal | 4 | 0.629 | -82.60869565 | 399.2063492 |
| white bread | 13 | 0.99 | ||
| low carb bread | 7 | 2.39 | -46.15384615 | 141.4141414 |
| flour tortillas | n/a | n/a | n/a | n/a |
| low carb tortillas | n/a | n/a | n/a | n/a |
| white rice | 32 | 4.19 | ||
| brown rice | 34 | 4.66 | 6.25 | 11.21718377 |
| cookies/cakes | n/a | n/a | n/a | n/a |
| low carb cookies/cakes | n/a | n/a | n/a | n/a |
| soda | 39 | 3.12 | ||
| diet soda | 3.12 | -100 | ||
| chocolate candy | n/a | n/a | n/a | n/a |
| low carb choc. candy | n/a | n/a | n/a | n/a |
| candy misc | n/a | n/a | n/a | n/a |
| low carb candy misc | n/a | n/a | n/a | n/a |
| beer | ||||
| light beer | 11.7 | 7.76 | ||
| low carb beer | 2.6 | 7.76 | -77.77777778 |
In 15 pairs of food examined, 10 were found to have low carbohydrate options available in stores.
Of 10 items, 8 of the lower carbohydrate items were found to be more expensive than the regular carbohydrate items. These items were chocolate milk, ice cream, pizza, pasta, peanut butter, cereal, bread and rice. The three remaining items were the same price. These items were fruit juice, soda and beer.
The average percent change in price between regular carbohydrates and low carbohydrates items was -58.07%. In other words, this means that low carbohydrates foods were 58.07% more than regular carbohydrate foods.
Of the 11 items, 9 of the low carbohydrate items were lower in carbohydrates than the regular carbohydrate foods. Again whole-wheat pasta is the confounding factor. Correcting for fiber, whole-wheat pasta and white pasta contained the same amount of carbohydrates. Also, the type of brown rice at Grocery Store C contained more carbohydrates than the type of white rice. As a result, the brown rice contained 6.25% more carbohydrates than white rice.
Including whole-wheat pasta and brown rice the average percent change of carbohydrates between the low carbohydrate items and the regular carbohydrates items was -55.07%. In other words, on average, low carbohydrate foods contained 55.07% less carbohydrates than regular foods. If whole-wheat pasta and brown rice are removed from this analysis, the average change is -68.04%.
Grocery Store 3 (Save-a-Lot)
| Food | Carbs | Price | % Change in Carbs | % Change in Price |
| chocolate milk | n/a | n/a | n/a | n/a |
| low carb choc. Milk | n/a | n/a | n/a | n/a |
| ice cream | n/a | n/a | n/a | n/a |
| low carb ice cream | n/a | n/a | n/a | n/a |
| pizza | n/a | n/a | n/a | n/a |
| low carb pizza | n/a | n/a | n/a | n/a |
| white pasta | n/a | n/a | n/a | n/a |
| whole wheat pasta | n/a | n/a | n/a | n/a |
| fruit juice | n/a | n/a | n/a | n/a |
| low/no sugar juice | n/a | n/a | n/a | n/a |
| peanut butter | n/a | n/a | n/a | n/a |
| low carb peanut butter | n/a | n/a | n/a | n/a |
| cereal | n/a | n/a | n/a | n/a |
| ;low carb cereal | n/a | n/a | n/a | n/a |
| white bread | n/a | n/a | n/a | n/a |
| whole wheat bread | n/a | n/a | n/a | n/a |
| low carb bread | n/a | n/a | n/a | n/a |
| flour tortillas | n/a | n/a | n/a | n/a |
| low carb tortillas | n/a | n/a | n/a | n/a |
| white rice | n/a | n/a | n/a | n/a |
| brown rice | n/a | n/a | n/a | n/a |
| cookies/cakes | n/a | n/a | n/a | n/a |
| low carb cookies/cakes | n/a | n/a | n/a | n/a |
| soda | 41 | 1.4 | n/a | |
| diet soda | 1.4 | -100 | ||
| chocolate candy | n/a | n/a | n/a | n/a |
| low carb choc. candy | n/a | n/a | n/a | n/a |
| candy misc | n/a | n/a | n/a | n/a |
| low carb candy misc | n/a | n/a | n/a | n/a |
| beer | n/a | n/a | n/a | n/a |
| light beer | n/a | n/a | n/a | n/a |
| low carb beer | n/a | n/a | n/a | n/a |
The results of Grocery Store C are radically different from Grocery Store A and Grocery Store B. This was the discount grocery store in the less affluent area of town. Of 15 pairs of foods, the grocery store only carried one low carbohydrate alternative. This item was soda.
The percentage change in price for this item was 0%. The percent change in carbohydrates for this item was 100%.
Averaging the total percentage change in cost across all three stores equaled 50.53% change.
Averaging the total percentage change in carbohydrates across all three stores equaled -77.61% change.
Meat vs. Pasta
The numbers above only compare foods that contain carbohydrates and have low carbohydrate counterparts. This effectively factors out the cost of meat in the above analysis. In order to present a stronger argument, a per-calorie comparison of meat and pasta is below. Cost per 2000 calories is also presented to give a more realistic price figure for the 2000 RDA calorie allotment (although eating 2000 calories purely of meat or pasta would not be recommended).
| Product | Price/oz | Calories/oz | Price/Calorie | Price for 2000-calories |
| Chicken Breast | 0.249375 | 31.45 | 0.007929253 | 15.85850556 |
| Chuck Steak | 0.280625 | 57.55 | 0.004876195 | 9.752389227 |
| Chicken Thighs | 0.105625 | 40.61 | 0.00260096 | 5.201920709 |
| Ground Beef | 0.136875 | 80 | 0.001710938 | 3.421875 |
| Pasta (spaghetti) | 0.0622 | 105 | 0.000592381 | 1.184761905 |
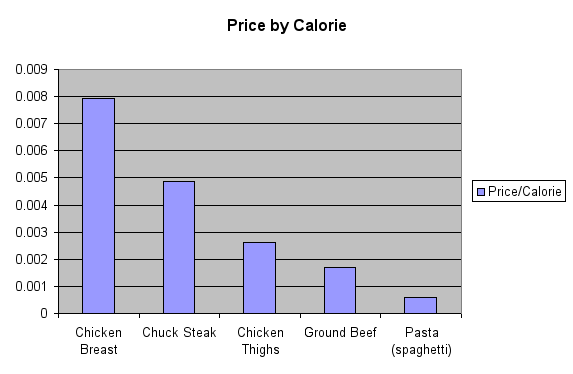
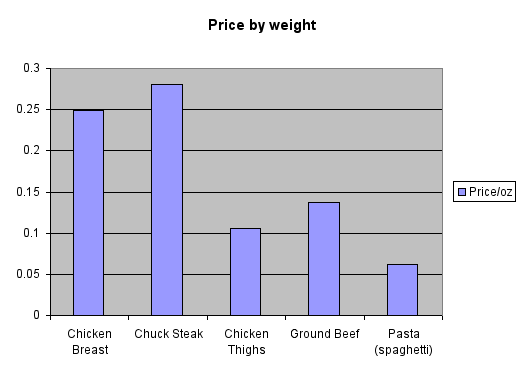
Of the four types of meat compared to pasta, all four proved to be more expensive per calorie than pasta. On average, meat was 622% the cost of pasta per calorie, which chicken breast in particular being over 13 times more expensive.
Discussion
The results from this content analysis of food in three Nashville area grocery stores show that eating a low carbohydrate diet can cost someone at least 50.53% more than eating the same full carbohydrate versions of the same food. This shows that people of a lower socioeconomic status, who have less money to devote to their food budgets, are at a disadvantage in purchasing these foods. It also demonstrates a possible problem of access. The grocery store in the area with a lower socioeconomic status only carried 1 of the 15 items is this analysis. If someone in this area wanted access to these foods, they would have to inconvenience themselves in order to do so.
Also, the percentage change in carbohydrates showed the low carbohydrates do effectively lower the rates of carbohydrates in food, which is imperative in a low carbohydrate model.
Similar implications result from the price per 2000 calories analysis of meats compared to pasta. It is much more economical to provide pasta as a main dish at a meal than meat. Because pasta is so high in carbohydrates and meat contains no carbohydrates, consuming a meal of pasta in reference to a low carbohydrate nutritional paradigm would be extremely unhealthy.
In an attempt to suggest that the economical nature of many normal carbohydrate foods motivated people, especially those of lower socioeconomic statuses to consume them, I planned to run statistical regressions on the data from the NHANES. The most important result from these regressions was the correlation between poverty income ratio and carbohydrates. This was the focus of my research design, and if this had proven either not significant or positively correlated, my design would have nullified my hypothesis. If I had found any of the other variables gave opposite results, it would have weakened my argument, but not necessarily disproved it.
Limitations
I believe looking not only at grocery stores, but also in “one stop shopping” and membership or club type stores like “Sam’s Club” and “Wal-mart” might have provided an interesting element to the study. It would be interesting to see in these large stores if selection is improved across-the-board (including low carbohydrate items) or simply improved in terms of low cost items.
An interesting phenomenon occurred during my research that I believe warrants further study. Specifically, when I was looking at the nutritional information and price for peanut butter I noticed three varieties: regular (with added sugar), natural (with no added sugar) and low carbohydrate (with added non-nutritive sweetener). These three varieties of peanut butter were all within 5, 4 and 3 grams of carbohydrate grams respectively (corrected for fiber). Yet, the peanut butter marketed as low carbohydrate was more than a dollar more than the natural peanut butter. This raised the issue of how marketing of items as low carbohydrate perhaps inflates their prices. This in turn places an additional caveat on my research: perhaps the difference in price was partly due to marketing costs incurred by producers of low carbohydrate food. Yet, the fact that products already exist that are only negligible “worse” to consume than marketed low carbohydrate alternatives yet cost considerably less seems like a topic worth additional exploration.
1 Kubik, Martha, Y. Lytle, Leslie A, Hannan, Peter, J. Perry, Cheryl L. Story, Mary. “The association of the school food environment with dietary behaviors of young adolescents” American Journal of Public Health. Washington: Jul 2003. Vol. 93, Iss. 7; pg. 1168
2 Patterson, Ruth E. Kristal, Alan R. Shannon, Jackilen. Hunt, Julie R. White, Emily. “Using a brief household food inventory as an environmental indicator of individual dietary practices” American Journal of Public Health. Washington: Feb 1997. Vol. 87, Iss. 2; pg. 272, 4 pgs
3 Retzlaff, Barbara M. Dowdy, Alice, A. Walden, Carolyn E. Bovbjerg, Viktor E. Knopp, Robert, H. “The Northwest Lipid Research Clinic Fat Intake Scale: Validation and utility” American Journal of Public Health. Washington: Feb 1997. Vol. 87, Iss. 2; pg. 181, 5 pgs
4 Champagne, Catherine, M. Bogle, Margaret L. McGee, Bernestine, B. Yadrick, Kathy. “Dietary Intake in the Lower Mississippi Delta Region: Results from the
Foods of Our Delta Study” Journal of the American Dietetic Association. Chicago: Feb 2004. Vol. 104, Iss. 2; p. 199-209
5 Kayrooz, Kathyrn, Mot, Taryn F. Yanek,Lisa R. Becker, Diane M. “Dietary fat patterns in urban African American women”. Journal of Community Health. New York: Dec 1998. Vol. 23, Iss. 6; pg. 453, 17 pgs
6 Bessesen, Daniel H. “The Role of Carbohydrates in Insulin Resistance” Journal of Nutrition. 2001 131: 2782S-2786S.
7 Robbins, Jessica M. Vaccarino, Viola. Zhang, Heping. Kasl, Stanislav, V “Socioeconomic status and type 2 diabetes of African American and non-Hispanic white women and men: Evidence from the Third National Healthy and Nutrition Examination Survey”. American Journal of Public Health. Washington: Jan 2001. Vol. 91, Iss. 1; pg. 76, 8 pgs
8 Little, Paul, Burnett, Jane, Margetts, Barrie, Kinmonth, Ann-Louise. “The validity of dietary assessment in general practice” Journal of Epidemiology and Community Health. London: Mar 1999. Vol. 53, Iss. 3; pg. 165, 8 pgs
9 Rankin, Janet Walberg, Winett, Richard A. Anderson, Elieen S. Bickley, Patricia G. Journal of Nutrition Education. Hamilton: Mar/Apr 1998. Vol. 30, Iss. 2; pg. 82-89
10 Haas, Jennifer S. Lee, Lisa B. Kaplan, Celia P. Sonneborn, Dean.
American Journal of Public Health. Washington: Dec 2003. Vol. 93, Iss. 12; pg. 2105
11 Report Title: Health, U.S., 2002 Issued By: National Center for Health Statistics; Publication Date: August, 2002; Table on Page(s): 60
12 Goodman, Elizabeth, Slap, Gail, B. Huang, Bin, American Journal of Public
Health. Washington: Nov 2003. Vol. 93, Iss. 11; pg. 1844
13 Wang, Youfa. International Journal of Epidemiology. Oxford: Oct 2001. Vol.
30, Iss. 5; p. 1129
14 Kim, Soowon, Symons, Michael, Popkin, Barry M. “Contrasting Socioeconomic Profiles Related to Healthier Lifestyles in China and the United States”. American Journal of Epidemiology. Oxford: Jan 15, 2004. Vol. 159, Iss. 2; pg. 184
15 Jeffery, Robert W, French, Simone A. American Journal of Public Health.
Washington: Jul 1996. Vol. 86, Iss. 7; pg. 1005, 6 pgs
16 McLaughlin, Carry. Tarasuk, Valerie. Kreiger, Nancy. “An examination of at-home food preparation activity among low-income, food-insecure women”. Journal of the American Dietetic Association. Chicago: Nov 2003. Vol. 103, Iss. 11; p. 1506-1513.
17 Mazur, Robert E. Marquis, Grace M. Jensen, Helen H. “Diet and food insufficiency among Hispanic youths: Acculturation and socioeconomic factors in the third National Health and Nutrition Examination Survey”. The American Journal of Clinical Nutrition. Bethesda: Dec 2003. Vol. 78, Iss. 6; p. 1120
18 Drewnowski, Adam. “Fat and Sugar: An Economic Analysis”
Journal of Nutrition. 2003 133: 838S-840S
19 Norris, Jean. Harnack, Lisa. Carmichael, Suzan. Pouane, Thandi. “US trends in nutrient intake: The 1987 and 1992 National Health Surveys”
American Journal of Public Health. Washington: May 1997. Vol. 87, Iss. 5; pg. 740, 7 pgs
20 Greene P J. Devecis, J. Willett, WC. “Effects of low-fat vs ultra-low-carbohydrate weight-loss diets: A 12-week pilot feeding study” Journal of Parenteral and Enteral Nutrition. Silver Spring: Jan/Feb 2004. Vol. 28, Iss. 1; pg. S13, 2 pgs
21 Landers, Susan J. “Atkins results leave dieters and researchers at a loss”. American Medical News. Chicago: Dec 23-Dec 30, 2002. Vol. 45, Iss. 48; pg. 28, 1 pgs
Perhaps of relevance: http://www.abc.net.au/rn/ta…